Investment Education
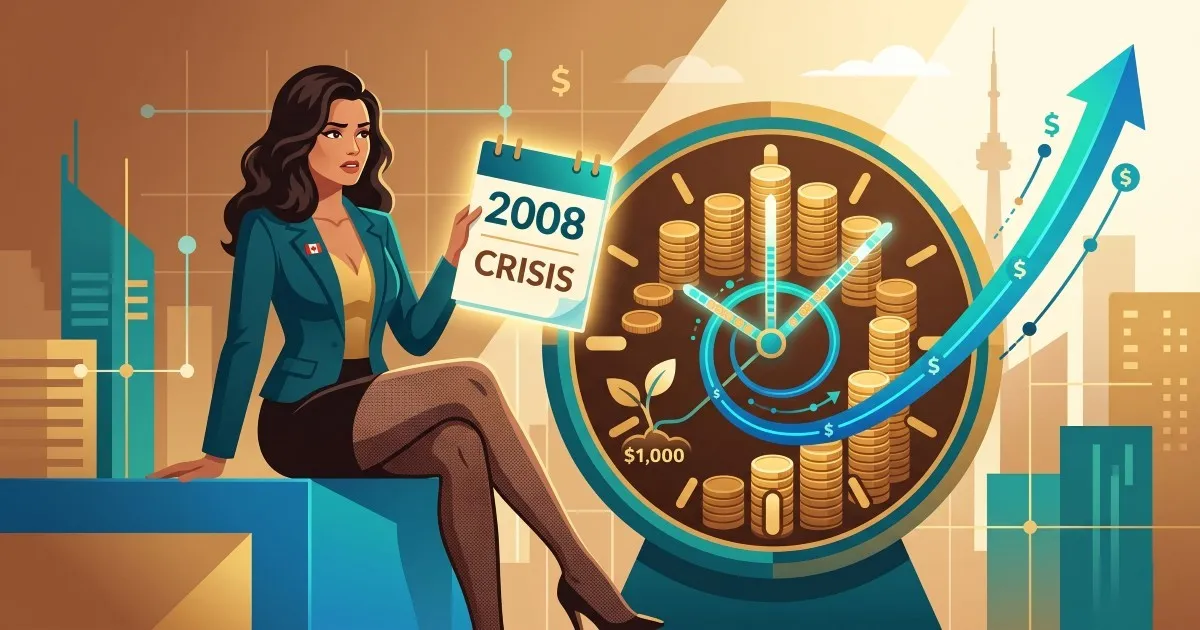
The 2008 Financial Crisis: What a $1,000 Investment Would Have Felt Like Living Through It
Read all the 2008 financial crisis narratives, and you'll see a drastic contrast between reading those and having lived through the pain of being an investor in 2008. Reading the h
- By
- David Woodbridge, CPA
- Published
- Last updated
- Reading time
- 10 min read
Key takeaways
- The chain-reactive crisis: Housing Stress > Numerous Real-Estate Financing Products > Leverage > Loss of Confidence > Forced Selling
- Broad stock-market declines looked systemic rather than cyclical, reflecting a deep credit shock that damaged confidence, market values, and institutions' ability to fund themselves.
- High quality Government bonds generally did a very good job of weathering the significant panic, thus assisting diversified/balanced portfolios with greater stability during the sudden downturn
- The main lesson for long-term investors was not predicting markets, but preparing for deep drawdowns and short-term liquidity stress before a crisis arrives.
Read all the 2008 financial crisis narratives, and you’ll see a drastic contrast between reading those and having lived through the pain of being an investor in 2008. Reading the historical summary shows that the market crashed, then rebounded, and eventually rewarded patient investors.
Experiencing the financial crisis was a different reality. Watching a portfolio lose a significant (30-40 percent) portion of its value over the course of several months was scary enough on its own, but the daily headlines detailing the downfall and/or bailouts of some of the nation’s largest banks, and not knowing if the financial system would ever regain stability, was more troubling. It was the first real test of long-term investing for many.
For many investors, it was much more difficult than anyone had imagined.
This article attempts to review the 2008 crisis as experienced through the lens of an investor who invested $1,000 in the broad equity index market, and it will highlight what lessons are learned from the 2008 crisis experience as it relates to investor behaviour, risks of investing, and the reasons for remaining patient with long-term investments.
The Setup: What Was Happening Before the Crash
In order to truly understand what happened in 2008, it is necessary to really understand what caused it.
Throughout the last several years of the previous decade, the value of homes in the United States steadily increased. Banks and lenders began to lend to borrowers who otherwise would not be able to qualify for a mortgage. These so called “sub-prime” mortgages were sold to investors all over the world through very complicated financial products. The logic used to price these financial products was based on the assumption that home prices would continue to rise, therefore the mortgage loans would seem less risky than they actually were.
When home prices started to decline in 2006 and 2007, the assumptions used to develop these investments started to fall apart. The number of missed mortgage payments started to rise, therefore the value of the complex financial instruments that contained the mortgage loans decreased quickly in value. Banks that held large amounts of these complex products found themselves in dire financial condition.
By the time we got to September of 2008, the financial crisis had reached a critical point. Lehman Brothers was forced to file for bankruptcy. The insurance company AIG needed to be bailed out by the federal government. The credit markets froze up and banks stopped lending to each other. The global financial system was genuinely at risk in a way not seen since the Great Depression.
The Crash in Numbers: Month by Month
The S&P 500 index peaked at approximately 1,565 points in October 2007-already showing signs of weakness before Lehman Brothers collapsed in September 2008. The bankruptcy, however, sharply accelerated the decline.
In September 2008 alone, the S&P 500 fell about 9%. By October 2008, it had dropped another roughly 17%. When the market hit its lowest point in March 2009, the index stood at approximately 676 points-a decline of about 57% from its 2007 peak.
Imagine a $1,000 investment made at that October 2007 peak-split across the broad S&P 500 index.
By September 2008-before the worst of the crash but already deep into the downturn-that $1,000 had fallen to roughly $780.
By the end of October 2008, it had declined further-down to approximately $620.
And by March 2009, at the market’s lowest point, it was worth around $430.
That’s not just a number in a textbook. It’s watching $1,000 become $430 over about 17 months-during which every week brought new evidence that things might get worse before they got better.
What Investors Were Reading and Feeling
Numbers tell part of the story. Context tells the rest.
In September and October of 2008, daily financial news was genuinely alarming. Headlines described the failure of Lehman Brothers, emergency government interventions to prevent AIG’s collapse, and a U.S. Congress that initially rejected the first version of the bank rescue package, causing markets to drop sharply in a single day.
Unemployment was rising. Home prices were falling. Retirement accounts were visibly shrinking. Many investors nearing retirement saw years of savings erased on paper within just a few months.
The prevailing sentiment in late 2008 and early 2009 was not that this was a buying opportunity. It was fear, and in many cases, despair. Respected economists and commentators debated seriously whether the global financial system could stabilize without a prolonged economic depression.
In that environment, selling felt entirely rational. Many people did exactly that, locking in losses to avoid the risk of further decline.
The Recovery: What Happened Next
The S&P 500 hit its low point on March 9, 2009. Most investors did not recognize it as the bottom at the time. The news was still bad. Unemployment was continuing to rise. Banks were still under pressure.
But prices stopped falling and began recovering. By year-end 2009, the S&P 500 had risen roughly 65% from its March low. The $430 that a $1,000 investment had shrunk to by March 2009 had grown back to approximately $710 by December 2009. Still a loss from the original investment, but no longer a catastrophic one.
By early 2013, roughly five and a half years after the October 2007 peak, the S&P 500 had fully recovered and surpassed its previous high. That original $1,000 was worth approximately $1,000 again, plus any dividends received along the way.
By the end of 2019, twelve years after the peak, that $1,000 had grown to roughly $3,200, assuming dividends were reinvested and no money was added or withdrawn.
The full return from peak to peak and beyond was extraordinary. But it required holding through a 57% decline, multiple false recoveries, years of economic uncertainty, and the psychological weight of watching a portfolio lose more than half its value with no guarantee of return.
The Investor Who Sold at the Bottom
Now consider a different scenario. An investor with the same $1,000 made the same investment in October 2007. By March 2009, rattled by 17 months of decline, they sold everything. Their $1,000 had become approximately $430 in cash.
They waited for things to feel more stable. By the time they re-entered, the S&P 500 had already recovered roughly 30% from its low. They reinvested their $430 in late 2009 at higher prices.
By the end of 2019, their $430 reinvested at late-2009 prices had grown to roughly $1,300 or so, depending on exact timing.
The investor who held through everything ended up with approximately $3,200. The investor who sold at the bottom and re-entered late ended up with approximately $1,300. Same starting amount. Same time period. The difference came entirely from two decisions made at the worst possible moment.
What Canadian Investors Experienced
The 2008 crisis hit Canadian markets as well, though Canada’s banking system proved more resilient. No major Canadian bank required a government bailout, in part because Canadian banks had less exposure to the toxic mortgage products that devastated U.S. and European institutions.
The S&P/TSX Composite fell roughly 50% from its 2008 high to its early 2009 low. Canadian investors in broad index funds experienced significant paper losses, though the recovery timeline was broadly similar to that of U.S. markets.
Canadian homeowners in most markets were not significantly affected by the kind of housing collapse that hit the United States. Prices dipped modestly in 2008 and 2009 before continuing higher through the 2010s.
For Canadian investors with diversified portfolios, the lesson was the same: time horizon and behaviour during the downturn mattered more than any other factor in determining the eventual outcome.
What This Means Today
The 2008 crisis is now far enough in the past that many younger investors have no personal memory of it. That distance can create a gap in intuition. Reading that markets fell 57% is very different from experiencing the feeling of watching it happen over 17 months while the financial news is consistently alarming.
The practical implication for investors today is this: the next significant market downturn, whenever it comes, will also feel frightening. The headlines will be alarming. Smart people will make credible arguments that this time is different. Some of those arguments will feel compelling.
The historical record suggests that investors who benefited most from crises had a clear strategy before the crisis hit, stayed invested through it, and in some cases added to their investments while prices were lower. That approach does not require predicting the timing or severity of a recovery. It requires trusting the long-term direction of the economy and maintaining enough financial stability in your personal life to avoid being forced to sell at the worst possible time.
Common Mistake to Avoid
The most common mistake linked to the 2008 crisis is the post-recovery decision to stay permanently in cash or conservative investments “just in case it happens again.”
Some investors who sold during the crash and then watched the recovery happen without them resolved never to put significant money back into stocks. The logic was understandable: they had been hurt badly and did not want to repeat the experience.
The cost of that decision was the entire decade-long bull market that followed. Inflation slowly eroded the purchasing power of money sitting in savings accounts and GICs. The wealth gap between those who re-entered the market and those who stayed in cash widened year by year.
Protecting yourself from market volatility by avoiding markets entirely trades a short-term emotional benefit for a very large long-term financial cost.
Conclusion
The 2008 Financial Crisis was one of the most terrible times to be a part of any stock market invested company, and while many people lost money due to their irrational fear of the recession, I believe that the decision of investors to cut their losses and sell at or near the bottom of the market was one of the worst financial decisions they made.
Most Stock Market investors (who are typically very educated, savvy, educated) believed that if they waited long enough after the “worst” of the recession had occurred (more than 2 years), that they would then have seen some certainty return to the economy prior to investing again at or near the bottom of the stock market, and t is now almost 11 years later since the Financial Crisis, and I have seen little if any evidence of certainty (other than a few “early adopters” of Newer technology products).
Frequently Asked Questions
How much did the stock market fall during the 2008 financial crisis?
The S&P 500 index fell approximately 57% from its October 2007 peak of around 1,565 points to its March 2009 low of approximately 676 points. The decline occurred over roughly 17 months and was the largest market drop since the Great Depression of the 1930s. Canadian markets declined by roughly 50% over a similar period, though Canada’s banking sector proved more resilient than that of the United States.
How long did it take for markets to recover after 2008?
The S&P 500 reached its low point in March 2009 and began recovering from there, though the news and economic conditions remained difficult for much of 2009 and 2010. The index fully recovered its October 2007 peak by roughly early 2013, approximately five and a half years after the high. Investors who held diversified portfolios throughout and reinvested dividends fully recovered their losses within that timeframe and went on to significant gains over the following years.
What should investors do to prepare for the next major market crash?
No one can predict with certainty when or how badly the stock market is going to crash, but the following strategies can help you cope with a market crash better. By owning a portfolio that reflects your true risk tolerance instead of simply choosing investments based solely on historical performance, you can avoid panicking and selling your investments during a market decline. Also, maintaining an emergency reserve of cash outside of your investments will prevent you from having to sell individual stocks to buy necessities during a stock market decline. Additionally, having a written asset allocation plan that contains provisions to deal with a stock market downturn and that has been reviewed prior to a stock market crash will provide you with something to rely on when emotions are running high during a stock market crash. Although none of these strategies will eliminate your losses during a crash, they will increase the likelihood that you will remain invested long enough to recoup your losses.
If you want to test this framework with your own numbers, use the interactive calculator and then compare outcomes in the scenario comparison hub.

About the author
David Woodbridge, CPA
Wealth Manager
David provides high-level financial strategy and tax-optimized investment solutions focused on fiscal responsibility and sustainable growth.
Background
David Woodbridge is a seasoned Wealth Manager at Bank of America, based in the United States. As a Certified Public Accountant (CPA), he brings a rigorous, analytical perspective to wealth management, specializing in the intersection of tax efficiency and long-term capital appreciation. David’s approach is built on the foundation of structured financial planning and meticulous risk assessment. He helps his clients navigate the complexities of high-net-worth portfolio management by integrating traditional investment wisdom with modern, tax-advantaged strategies. His professional background allows him to offer a comprehensive view of a client’s financial health, ensuring that every investment decision aligns with broader tax goals and generational wealth preservation. Committed to clarity and data-driven results, David serves as a trusted guide for those looking to secure their financial future through disciplined, transparent wealth management practices.
Methodology note
Figures are educational estimates based on historical market data and stated assumptions. They do not include every real-world variable (taxes, slippage, fees, behavior, or account constraints). Re-run the scenario with your own inputs before making decisions.
Related articles
Related tool
Backtest this idea with the investment calculatorMove from theory to measurable historical outcomes.