Markets
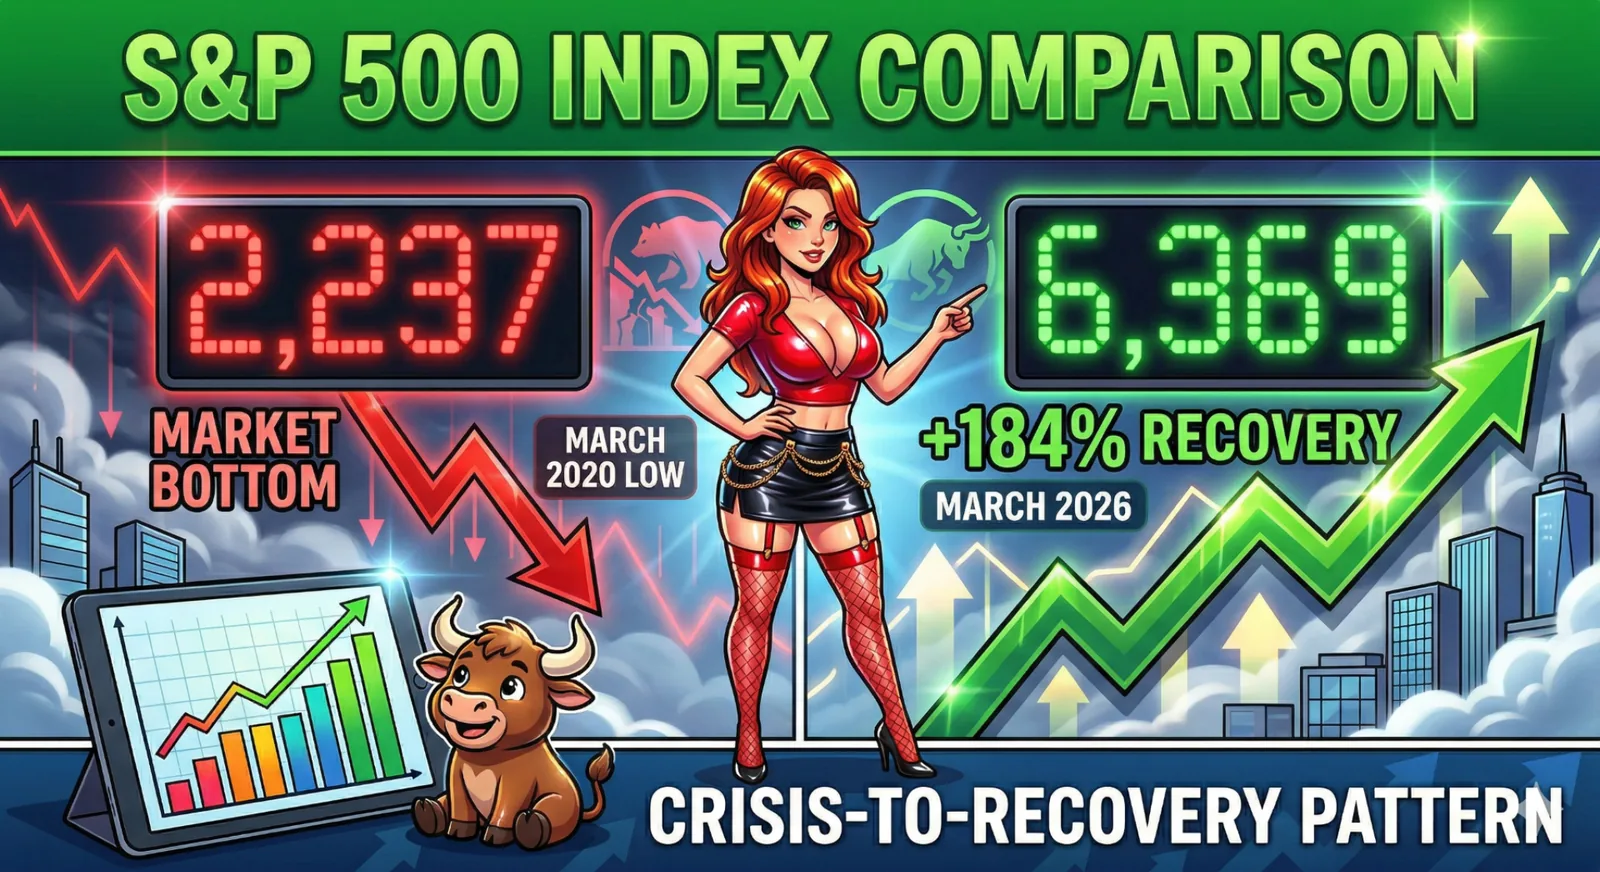
S&P 500 Comparison: Crisis-to-Recovery Pattern
This infographic tracks the crisis-to-recovery path from the March 2020 low to March 2026, including the +184% rebound window.
Open visualBrowse infographic-style explainers built from a manifest-driven visual dataset.
Markets
This infographic tracks the crisis-to-recovery path from the March 2020 low to March 2026, including the +184% rebound window.
Open visual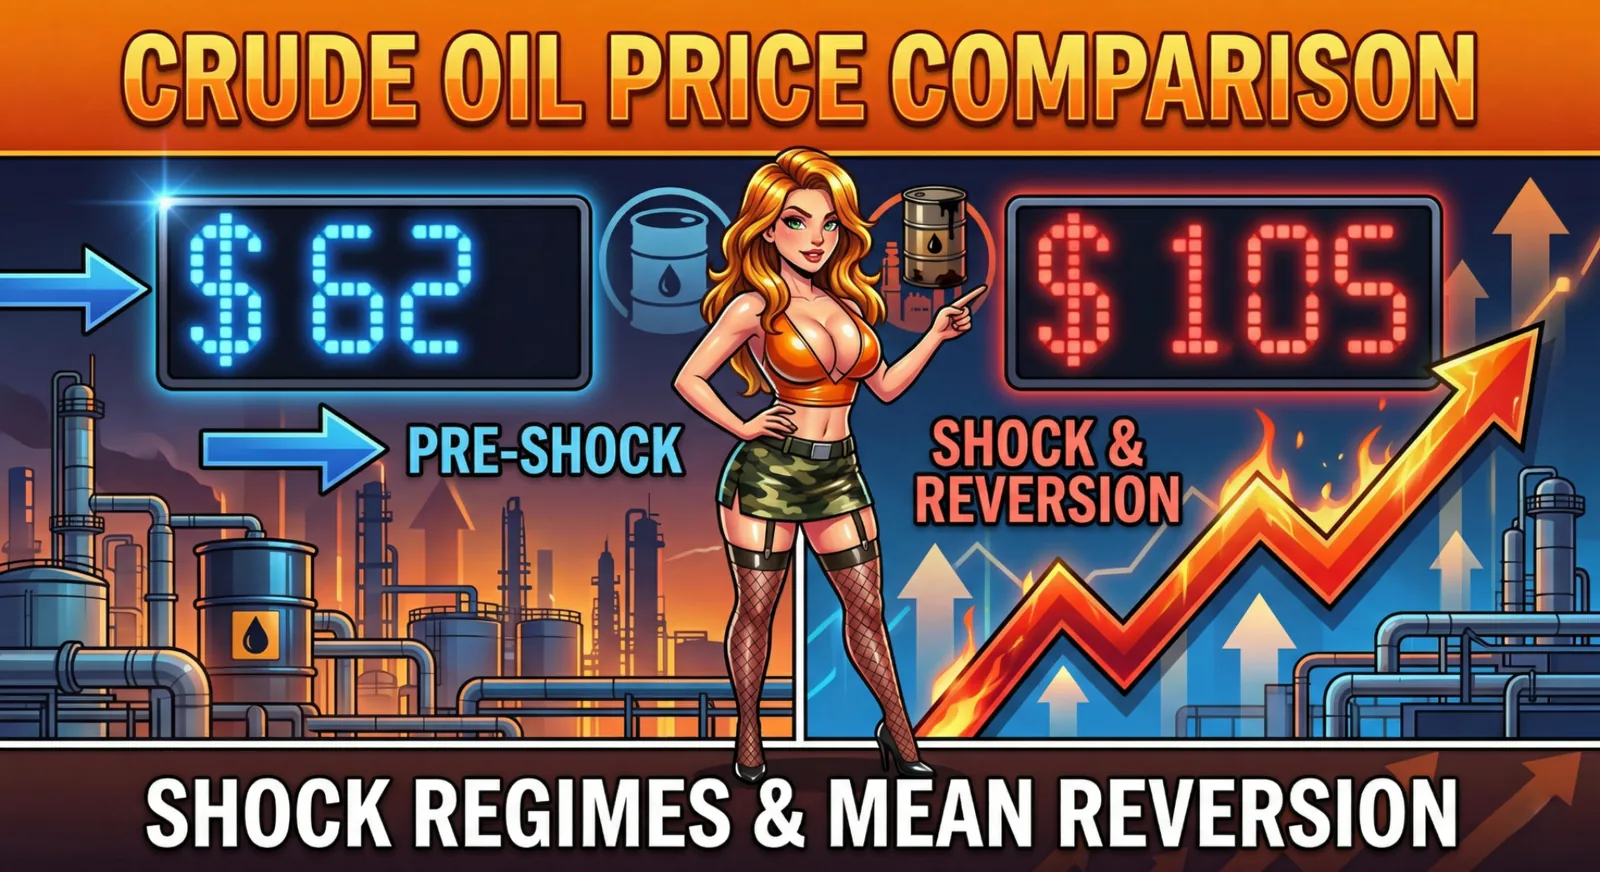
Commodities
This infographic frames crude oil as a shock-and-reversal sequence, emphasizing the move from $62 to $105 across the highlighted window.
Open visual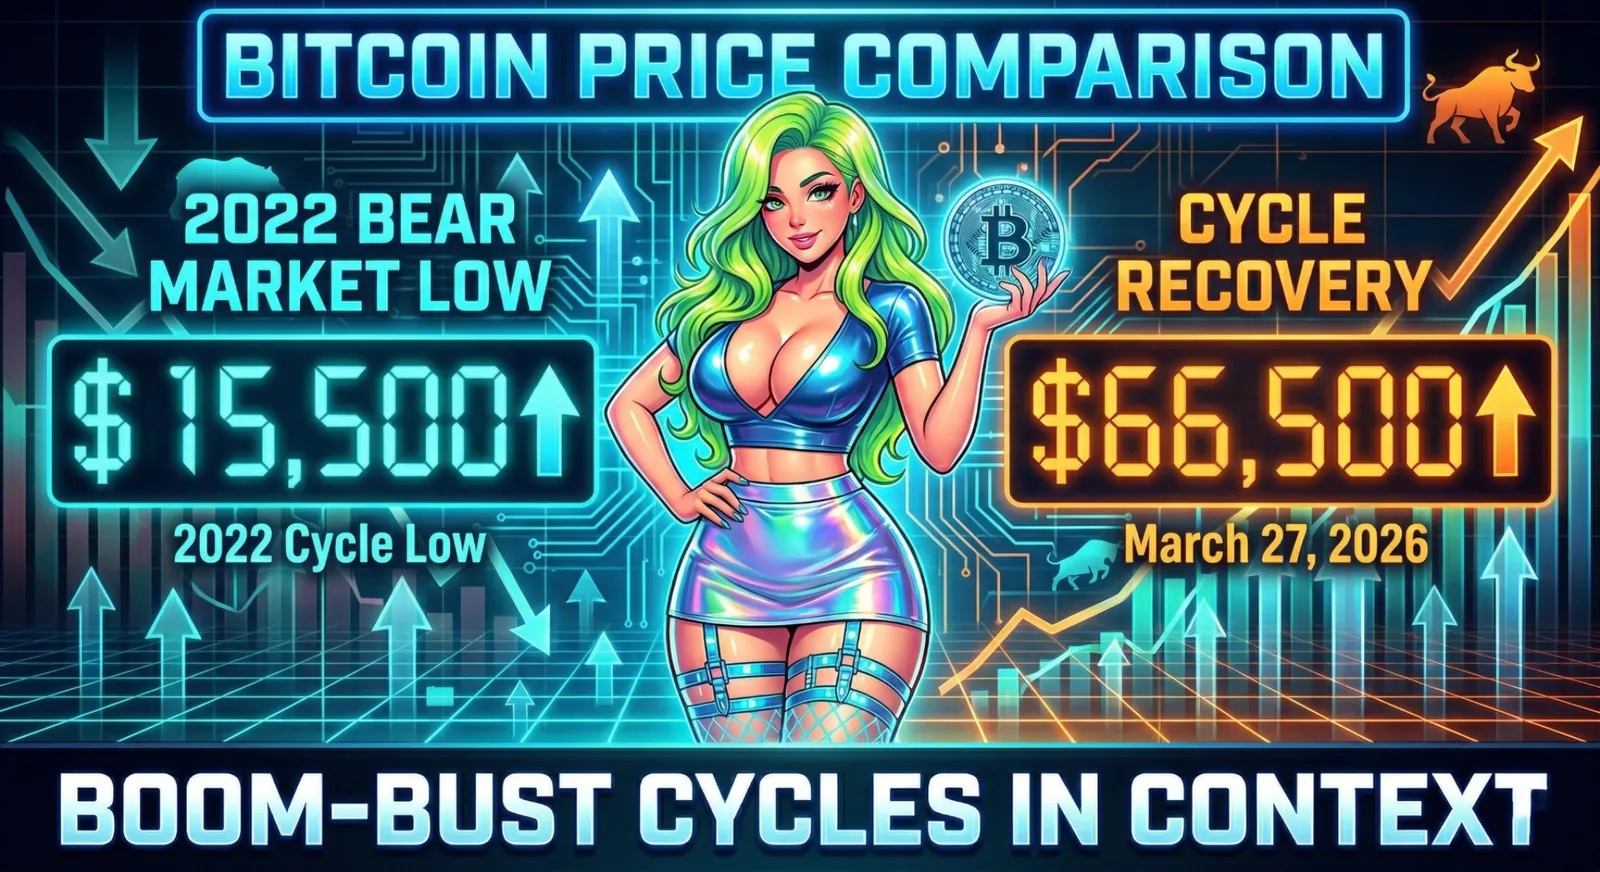
Crypto
This infographic pairs two cycle views: recovery from the 2022 low ($15,500 to $66,500) and the post-peak pullback to $66,338 (-40.8%).
Open visual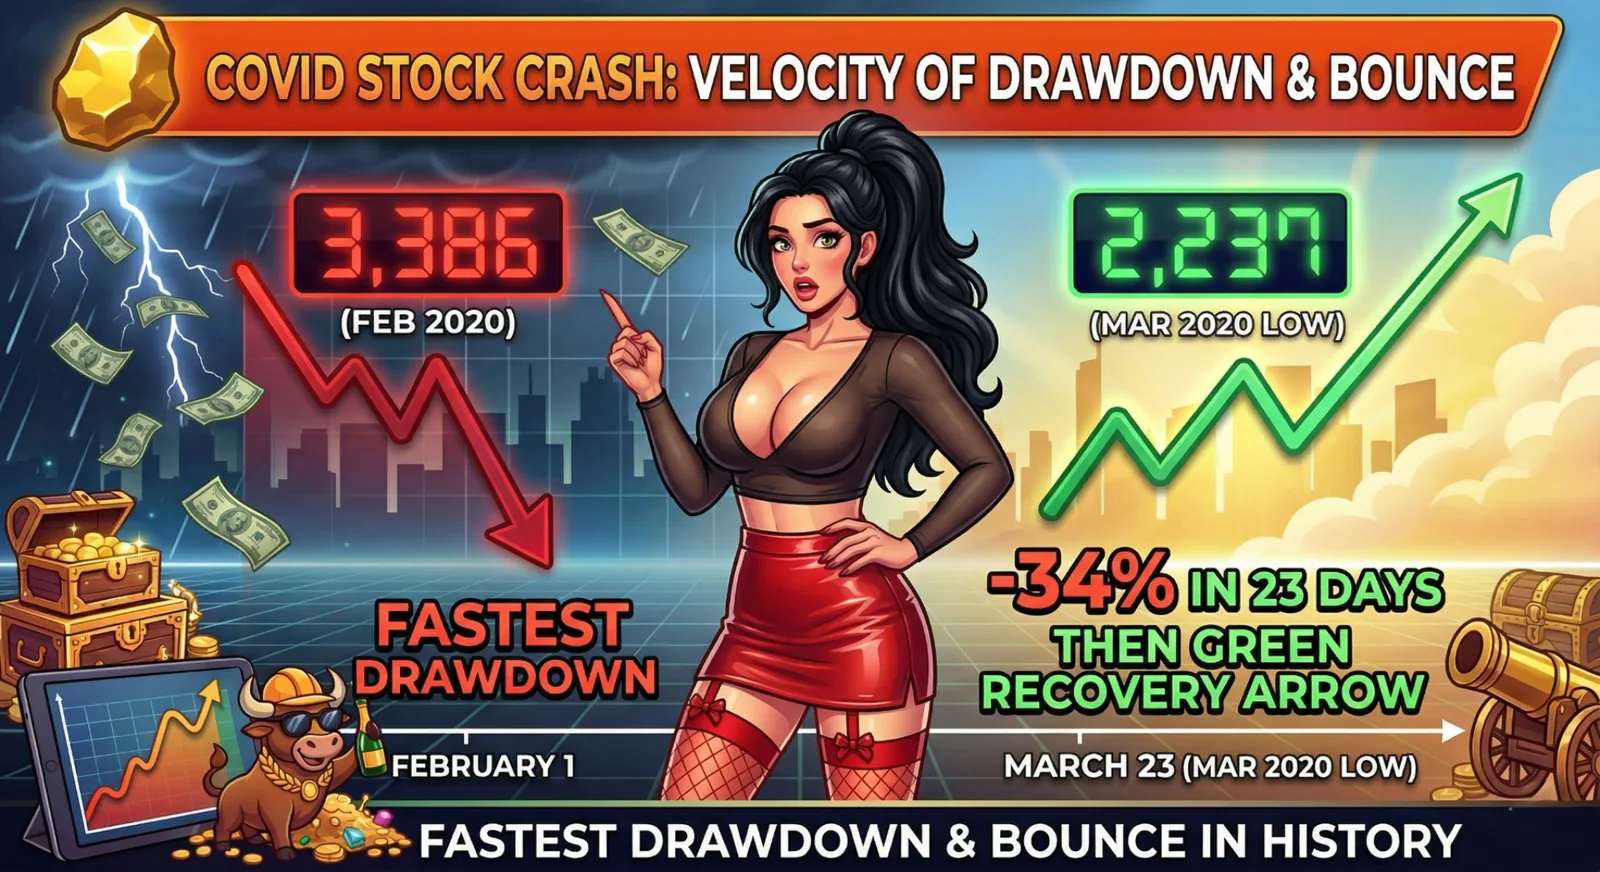
Markets
This visual isolates the fast 2020 shock window, from peak to bottom in 23 days, and shows the early rebound through May 2020.
Open visual Markets
This infographic tracks the crisis-to-recovery path from the March 2020 low to March 2026, including the +184% rebound window.
Open visual Commodities
This infographic frames crude oil as a shock-and-reversal sequence, emphasizing the move from $62 to $105 across the highlighted window.
Open visual Crypto
This infographic pairs two cycle views: recovery from the 2022 low ($15,500 to $66,500) and the post-peak pullback to $66,338 (-40.8%).
Open visual
Commodities
This infographic tracks the 2021 pre-tension baseline and the 2022–2026 tension window, where gold rises into the mid-$4,000s.
Open visual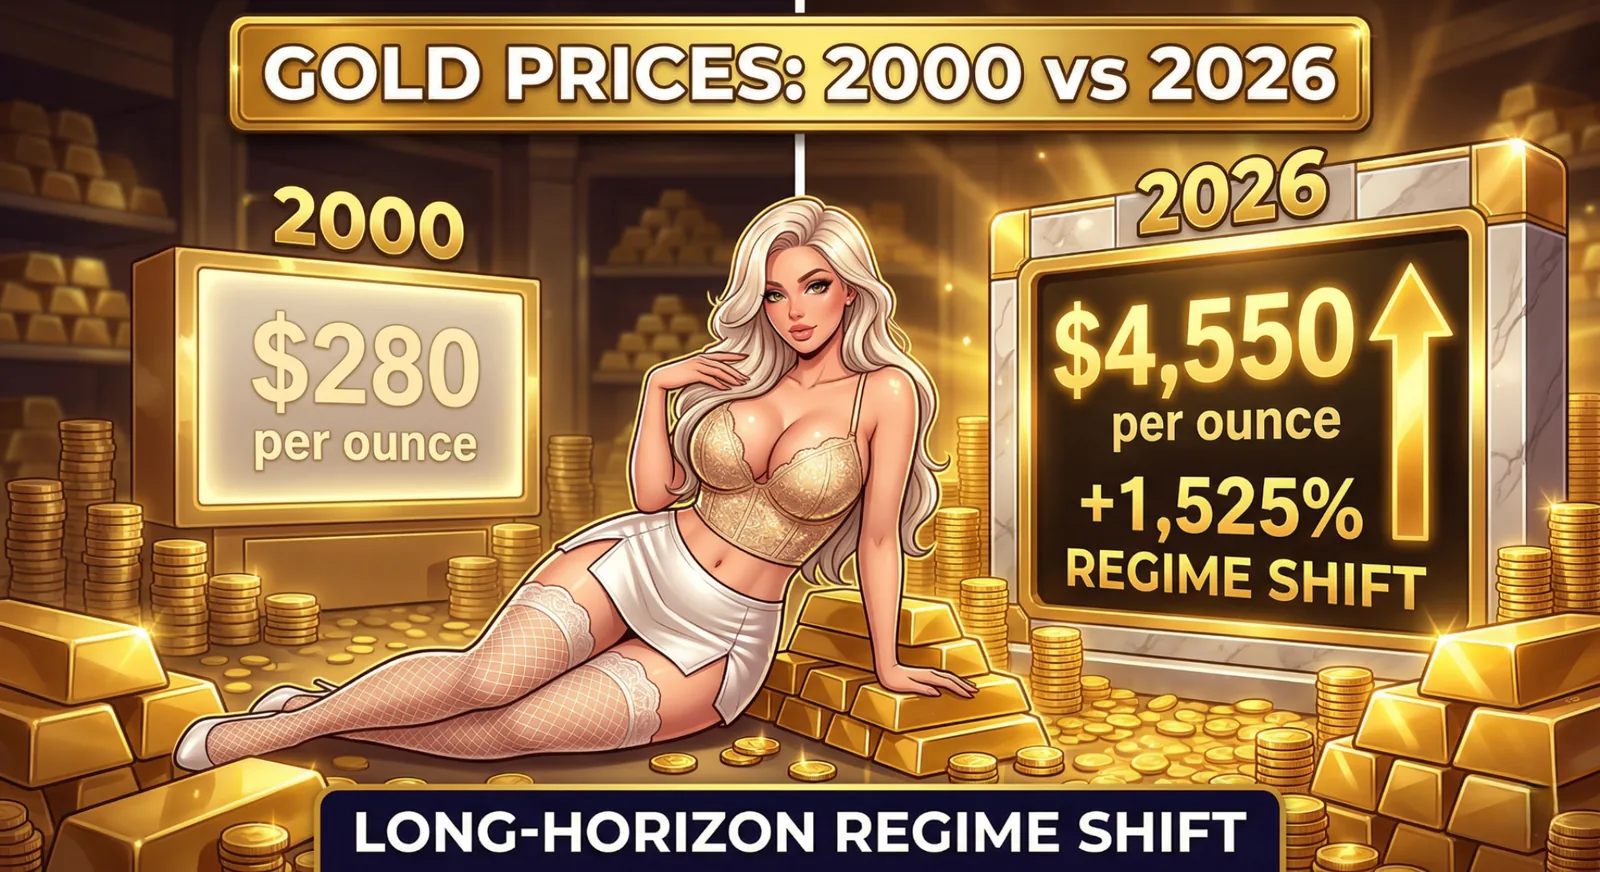
Commodities
This visual follows the full 2000–2026 path, from a $280 starting point to a $4,550 endpoint (+1,525%).
Open visual Markets
This visual isolates the fast 2020 shock window, from peak to bottom in 23 days, and shows the early rebound through May 2020.
Open visualNo visuals matched your filters.