Crypto
Bitcoin Comparison: Boom-Bust Cycles in Context
This infographic pairs two cycle views: recovery from the 2022 low ($15,500 to $66,500) and the post-peak pullback to $66,338 (-40.8%).

Quick Facts
- Coverage
- 2022 low to Mar 27, 2026
- Recovery leg
- $15,500 → $66,500
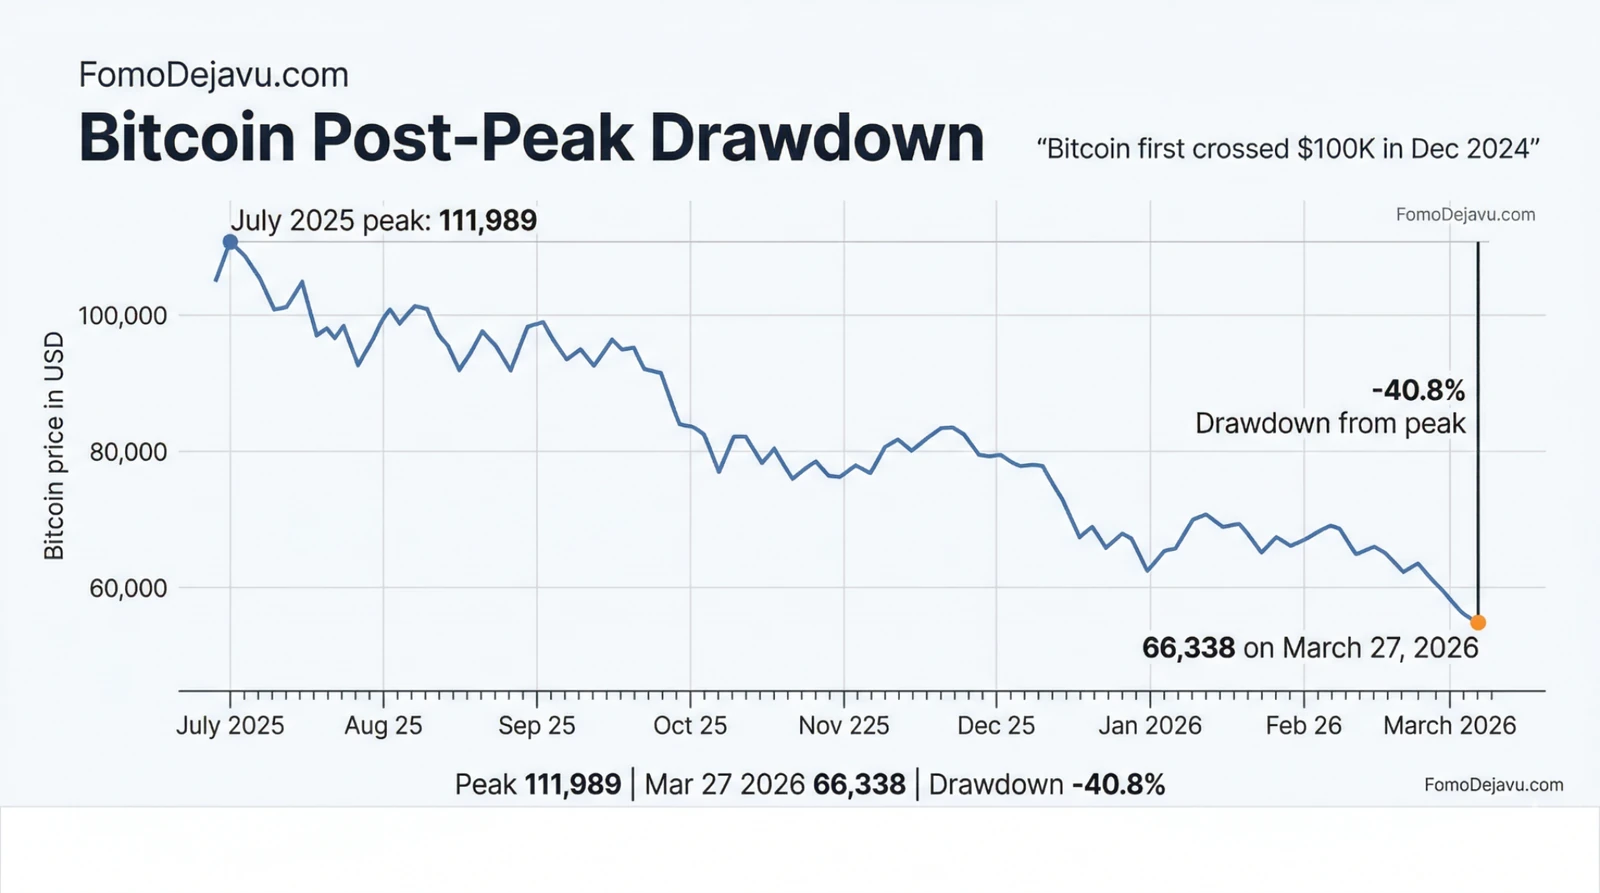
- Post-peak drawdown
- -40.8% (111,989 → 66,338)
Supporting Chart
Why It Matters
Cycle framing helps investors avoid overfitting one run. It clarifies how severe retracements can coexist with long-run adoption narratives.
Methodology Note
Cycle callouts follow the production chart annotations for the 2022 low, July 2025 peak, and March 27, 2026 endpoint.