Markets
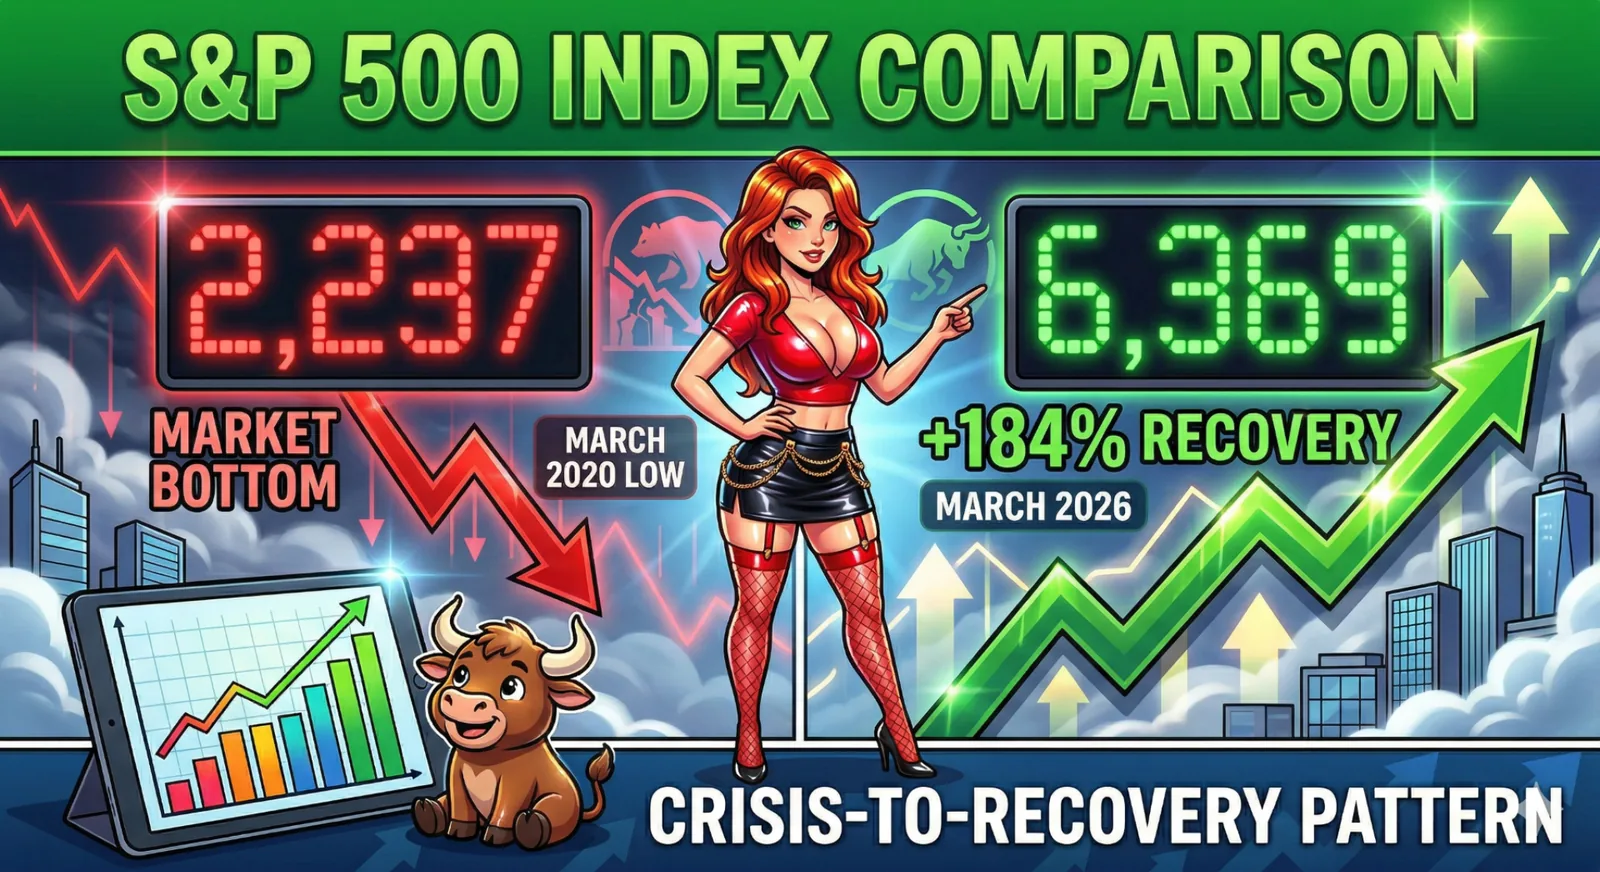
S&P 500 Comparison: Crisis-to-Recovery Pattern
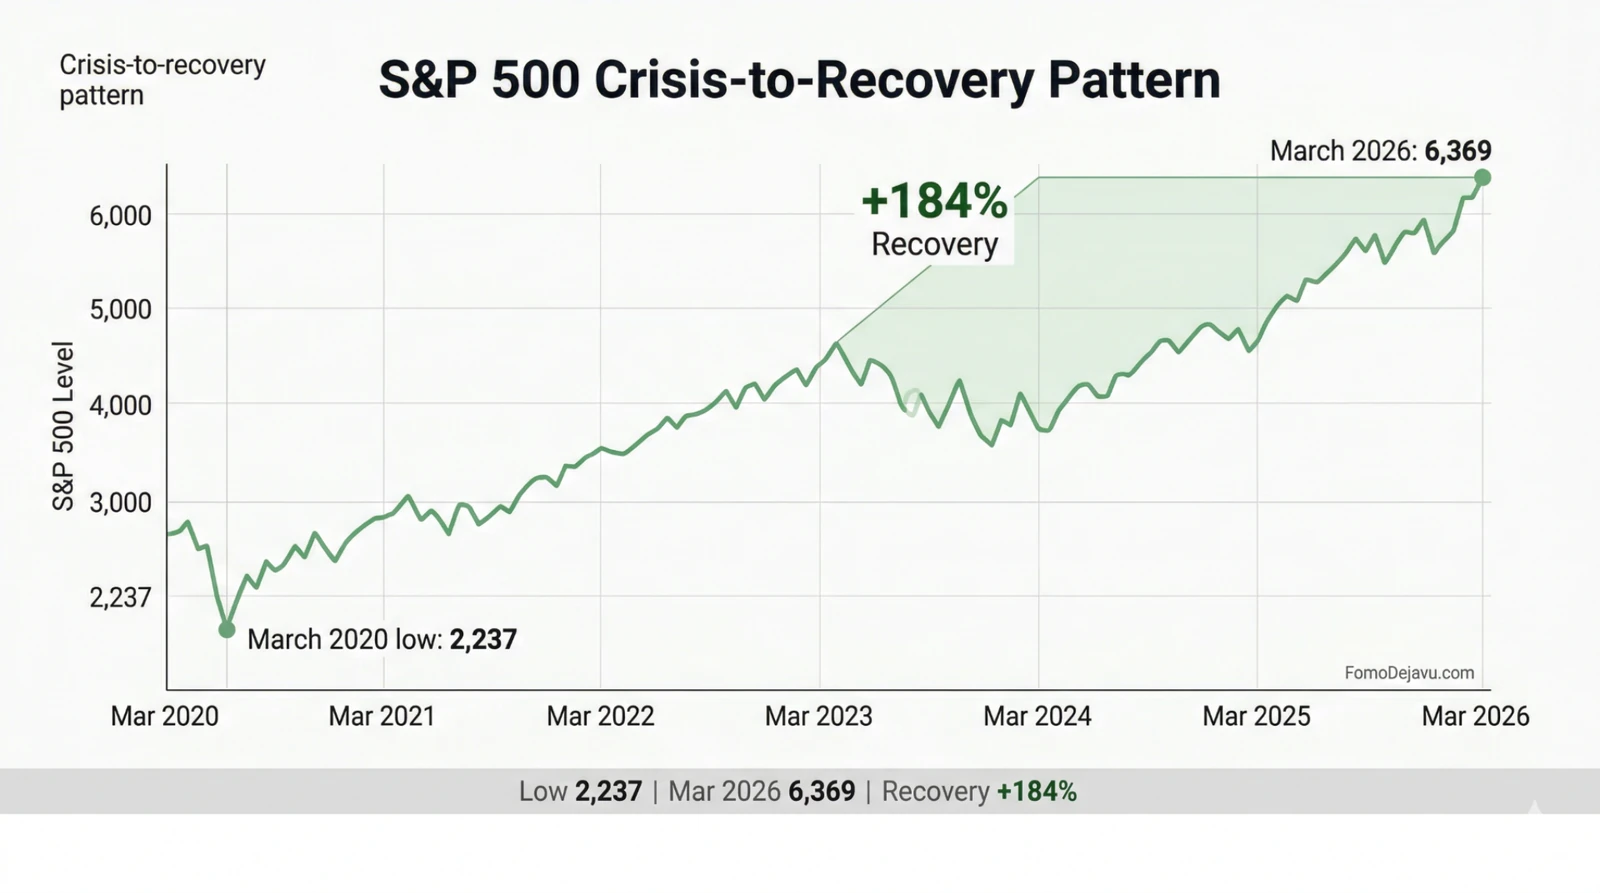
This infographic tracks the crisis-to-recovery path from the March 2020 low to March 2026, including the +184% rebound window.
Quick Facts
- Coverage
- Mar 2020–Mar 2026
- Key levels
- 2,237 → 6,369
- Recovery
- +184%
Supporting Chart
Why It Matters
Index narratives often emphasize endpoints. This visual surfaces sequencing risk and the real waiting time investors endure before prior highs are reclaimed.
Methodology Note
Series are indexed to a common baseline and plotted in monthly granularity for readability. Percent moves are rounded for presentation.