Markets
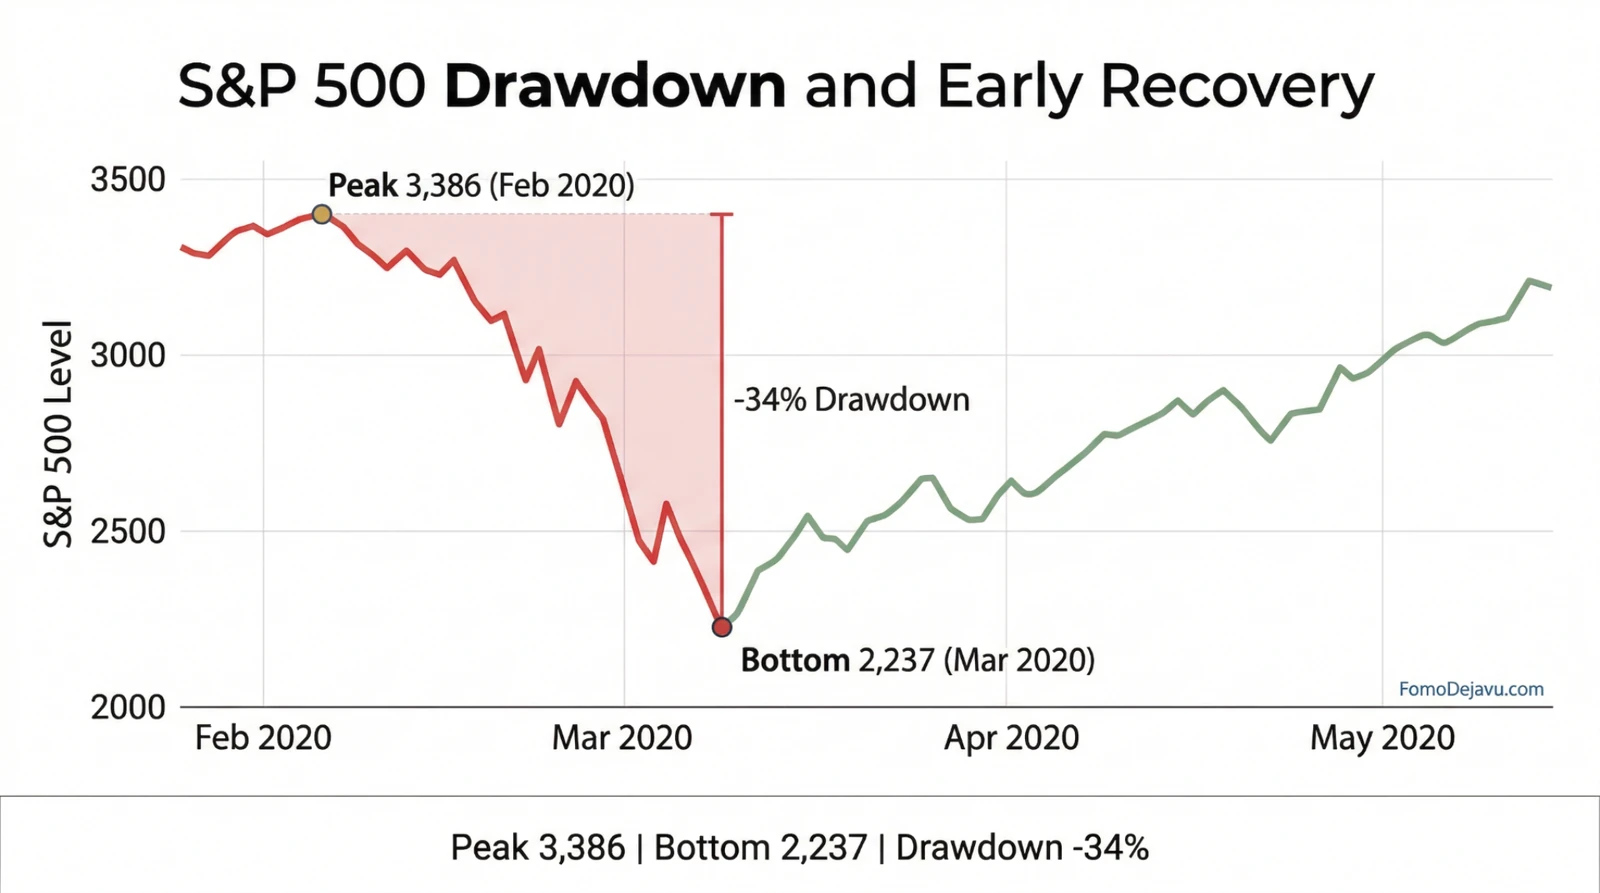
COVID Stock Crash: Velocity of Drawdown and Bounce
This visual isolates the fast 2020 shock window, from peak to bottom in 23 days, and shows the early rebound through May 2020.

Quick Facts
- Coverage
- Feb 2020–May 2020
- Peak to bottom
- 3,386 → 2,237
- Drawdown
- -34% in 23 days
Supporting Chart
Why It Matters
Fast drawdowns can trigger impulsive exits. Sequencing evidence helps frame behavior risk versus long-run outcome risk.
Methodology Note
Window uses daily closes aggregated to presentation-friendly intervals. Policy dates are included as timeline anchors only.