Commodities
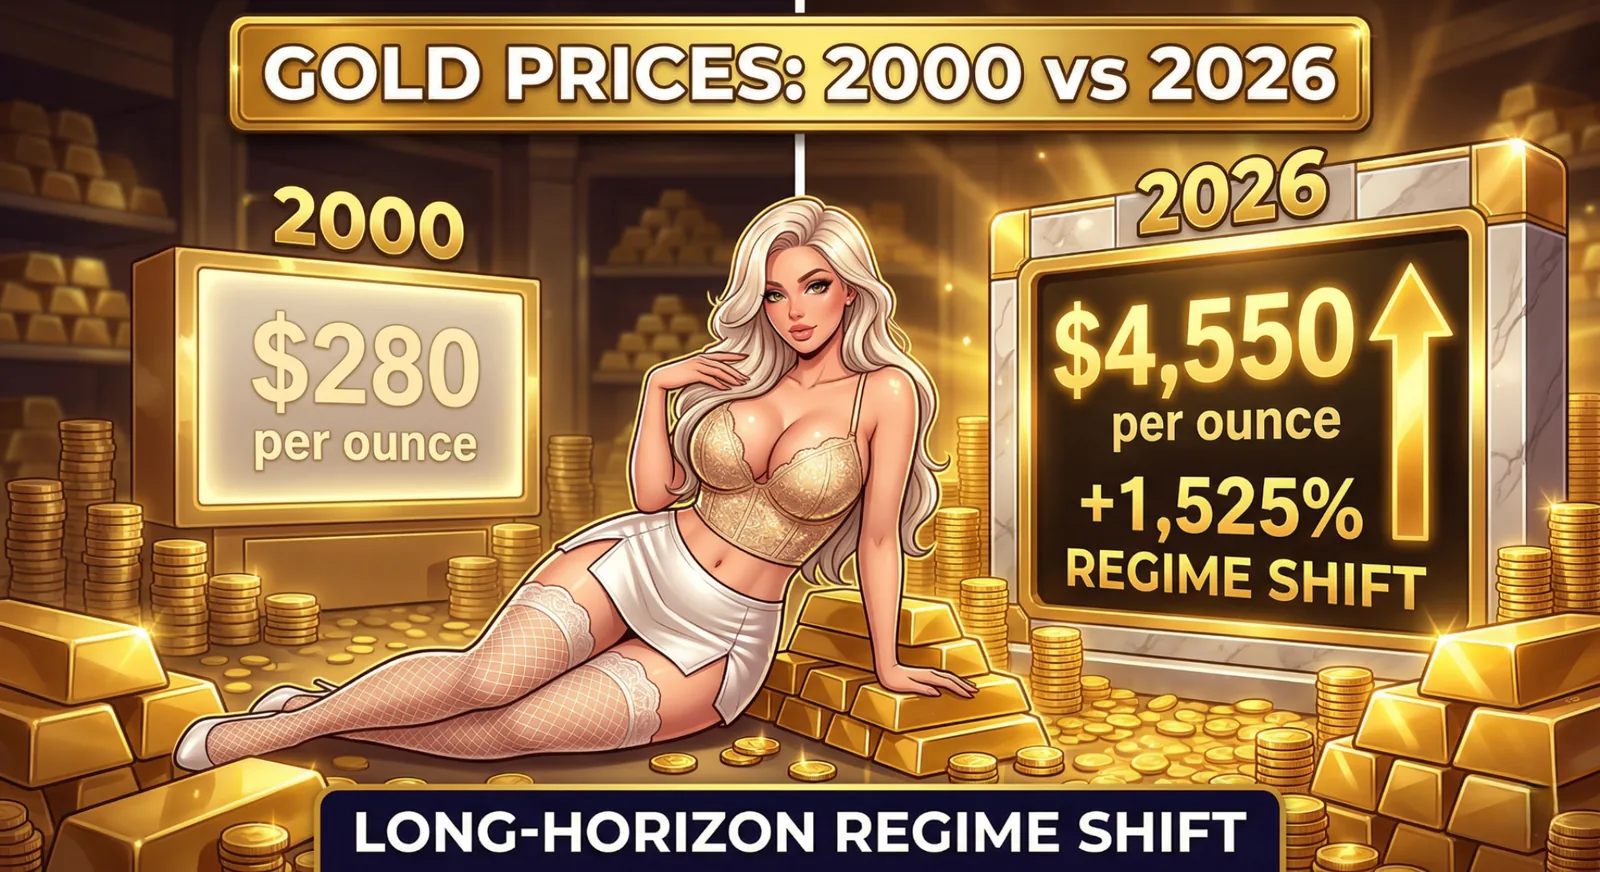
Gold 2000 vs 2026: Long-Horizon Regime Shift
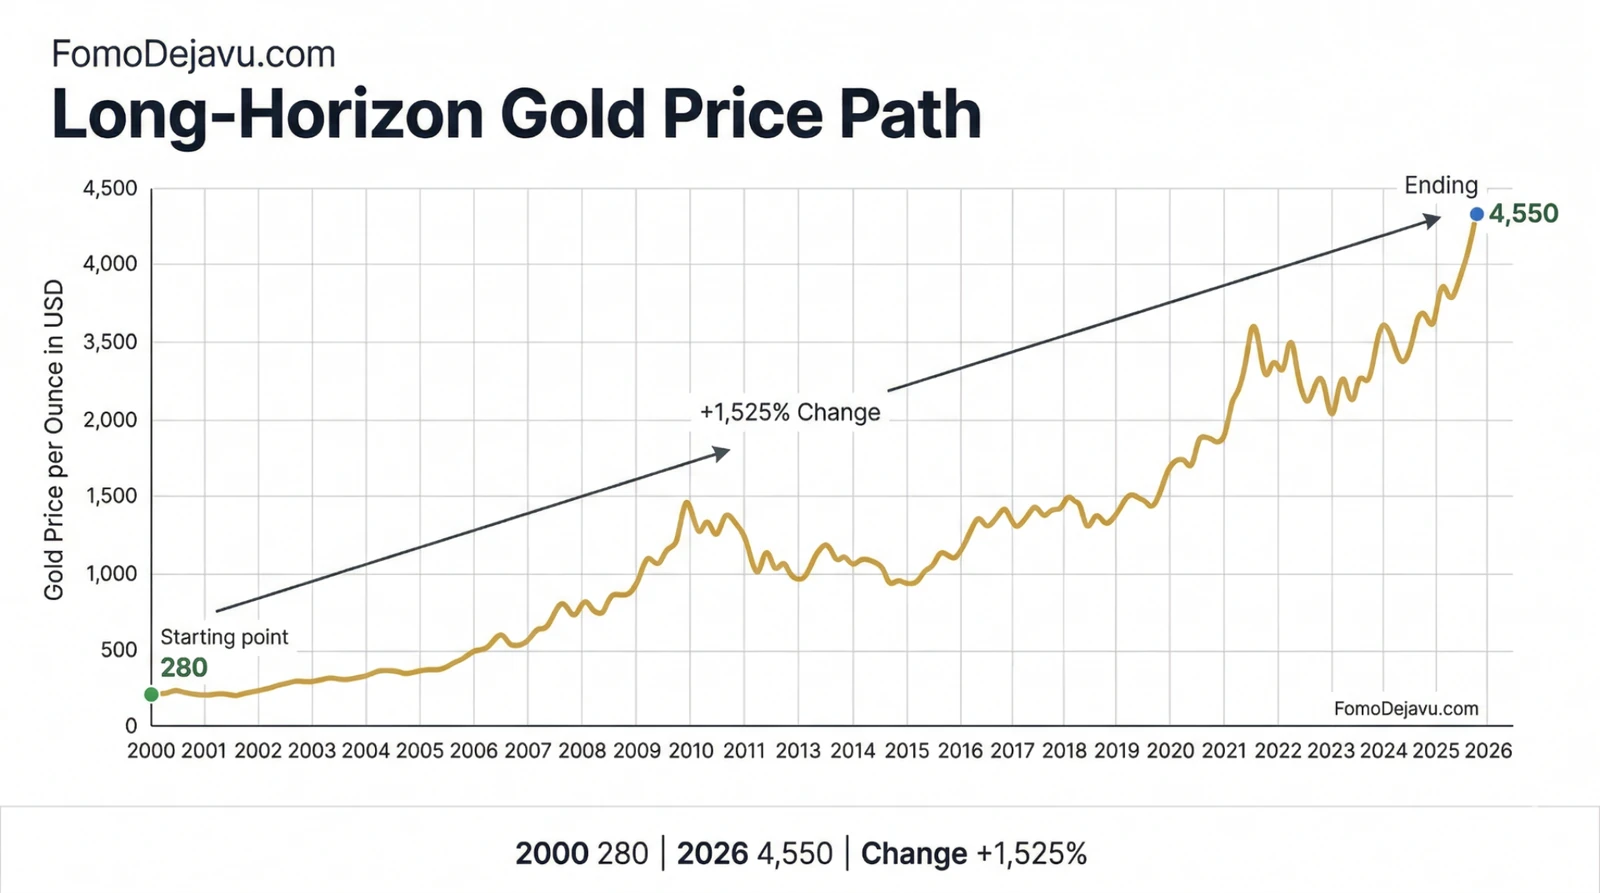
This visual follows the full 2000–2026 path, from a $280 starting point to a $4,550 endpoint (+1,525%).
Quick Facts
- Coverage
- 2000–2026
- Key levels
- $280 → $4,550
- Change
- +1,525%
Supporting Chart
Why It Matters
Long-run snapshots can overstate smoothness. Viewing the full path clarifies patience requirements and opportunity-cost trade-offs.
Methodology Note
Nominal levels are paired with indexed scaling for comparability. Data are displayed as informational context, not investment advice.