Commodities
Crude Oil Comparison: Shock Regimes and Mean Reversion
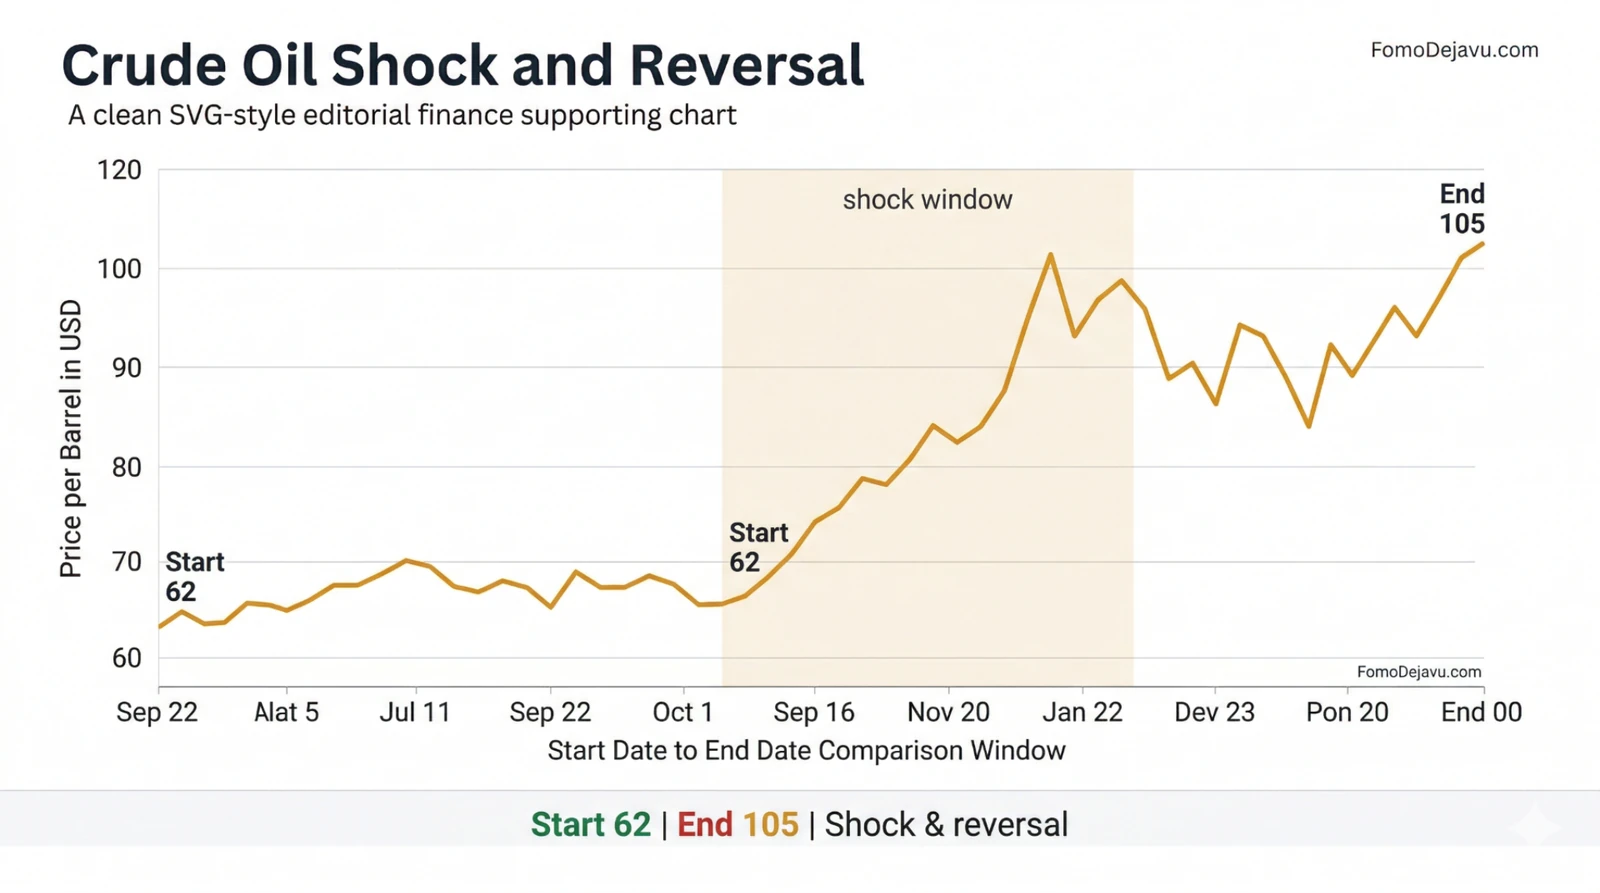
This infographic frames crude oil as a shock-and-reversal sequence, emphasizing the move from $62 to $105 across the highlighted window.

Quick Facts
- Window
- Highlighted shock window
- Start level
- $62 per barrel
- End level
- $105 per barrel
Supporting Chart
Why It Matters
Oil episodes can dominate headlines and distort portfolio decisions. Context helps separate cyclical shocks from durable trend changes.
Methodology Note
The supporting chart callouts use the same production-asset window values: start $62 and end $105.